2012/02/04

Break out the bubbly

Bubbles are fascinating market phenomena. They often end with a devastating crash – these occasions etch themselves into collective human memory because of the psychological devastation they cause. In retrospect it is almost always obvious that values were inflated, that the market was exceedingly fragile and that the good times would not last. But in the midst of the bubble all except a wise (and ignored) few are blind. It seems a fundamental flaw of human nature dooms us to repeating the same mistake time and again.

Famous bubbles

In order to entrench that what we call bubbles are real events, rather than just an academic construct, I think it is useful to list some of the more famous bubbles in world history.

Tulip mania (1585 - 1650): People invested heavily in tulips, a Dutch export. The price of tulip bulbs shot up as people mortgaged their houses and businesses to trade in tulips. In 1637, bulbs which people used to pay for dearly become nearly worthless when the bubble burst.

South Sea Bubble(1720): It is actually after this episode that the term “bubble” was coined. Here speculation was based on expectations of profitable trade with Spanish colonies in South America. This is a good example financial manipulation. The directors of the South Sea Company deliberately sought to drive up its stock price - this was done by creating an artificial hype around trading possibilities. A number of bogus companies (and some bona fide ones) also tried to cash in and swindled many investors. A famous example was a bogus company “for carrying on an undertaking of great advantage, but nobody to know what it is”. The bubble burst slowly but definitively, bankrupting many.

Roaring twenties (1922 – 1929): The stock market was the place to be. The man-on-the-street started investing in stocks – everyone thought they could make a fortune, and quickly. Many invested in the market with borrowed money. This time it was new industries that were thought be able to bring permanent prosperity. Bankers came under fire after 1929 for manipulating the market and bolstering the speculation. The crash of 1929 and the resulting depression are well known.

Dot com bubble (1995- 2000): With the advent of the internet, speculation in internet and technology companies took place. It was thought the old rules did not apply to this new industry.

These are just the more famous bubbles. There are many more examples of varying devastation. The financial crisis was partly caused by the bursting of a housing bubble in America. The unsavoury lending practices associated with this bubble are by now well known. Not all bubbles end in crashes. In the 1960s there was a bubble associated with electronic manufacturing, which ended less spectacularly than the examples described and as a result it has not earned a prominent place in history.

Bubbles are characterised by some defining features:

  1. There is a belief that prices will continue to rise indefinitely
  2. There is an overwhelming belief that (1) can be justified as circumstances are somehow different from previous bubbles. In the 1920’s it was “The New Era” of industry, in the 1990’s it was the “New Economy” caused by the internet.
  3. People exhibit a willingness to believe bordering on stupidity. People may be fooled by swindlers, by bankers, and, often, themselves. All that’s needed is an excuse to believe. No more.
  4. People purchase stocks (or other assets) purely for their resale value – the dividends or income from the asset become secondary and, in fact, may be traded away. For instance in the 1920’s people were willing to pay interest rates on loans far higher than the earnings on stocks hoping to sell the stock later at a higher price.
  5. There tend to be high levels of speculation, which can be taken to mean making risky investments with the possibility of a complete loss of capital, usually with borrowed money.
  6. The dismissal of “prophets of doom” who forecast the end of the bubble
  7. Right up until the end, everything seems good. There seems only to be cause for optimism. The cracks only seem to appear later.
  8. People focus on the fact that prices go up, rather than why they go up. Inevitably the why is that people expect prices to go up. So they go up.
  9. When the end comes people are reluctant to believe it. But efforts to revive the bubble inevitably fail.
  10. There is a “failure to know what isn’t known” as Galbraith puts it. People act is if they are knowledgeable – of course this stock will go up – but they do not know that they do not actually know.

How do bubbles form?

The origins of bubbles are not clear. We can identify some conditions which seem to be necessary and a number of others that help bubbles along.

Looking for a definite cause may be misleading – the structure of the market itself may be the cause. This is, essentially, what the dynamical systems models, as in my earlier post, posit. Here it is a process of contagion of opinion between investors that causes the bubble. People are optimistic because others are optimistic, which causes more people to become optimistic. All that’s needed is an initial spark and enough optimism to be generated from it. This is not deterministic – it’s an inherently random process.

It is clear that optimism is essential. People have to believe the story of the era to be tempted to invest. They need to blind to the risks they are taking. People need to have faith in others – mistrust results in caution, which does not favour speculation.

It helps if there is a large supply of savings. If this is the case people will be more willing to risk a part of their savings in the market (Economists would say that the marginal value of savings diminishes with increasing savings). In addition the availability of credit would make speculation easier. It allows people to buy far more stocks, driving prices higher. These are contributing factors, not a causes.

This suggests, then, that speculation-fuelled bubbles are more likely after a period of prosperity, which builds up confidence and savings, and may also result in fewer credit restrictions. The memory of previous bubbles and hardships needs to dull. As such it may be some time before the next bubble after the latest financial crisis appears. But it will come.

Why do bubbles burst?

It is tempting to think that bubbles burst because something happens. In the efficient markets view a huge crash must be caused by some dramatic and unexpected news. This does not seem to be the case. In hindsight, it is always possible to say this event or that caused the selling. But more often than not, there is no good reason why that event should have had such a catastrophic effect.

Dynamical systems theory, as mentioned in my earlier post, gives an alternative explanation. The truth is that after a period of speculation, the market is in an unstable state. A large number of market participants are acting in unison. All that is needed for a crash is for them all to decide to sell at once. The truth is that just about anything can cause this to happen, say slightly worse than expected economic figures. The true underlying cause of the crash is the bubble that caused the market to be in such an unstable state, not the event that bursts the bubble.

Bubbles seem to rely on a supply of new buyers, to whom those who want to cash in can sell. We may call these buyers fools, as they are purchasing an overvalued asset. However, they expect to sell to a “greater fool” who will purchase the asset at an even higher price. When this supply of greater fools dries up (as it inevitably does), prices decelerate.

When confidence diminishes, even just a little, it can cause the bubble to burst. The first wave of speculators sell, causing others to sell as well. Pessimism rapidly infects the market and sellers swamp buyers. If there were sales on margin, this can exacerbate the matter as these generally come with margin requirements. Speculators need to put up money as collateral for the stocks they bought on credit. The lower the price of the stock, the more of this money called margin is needed. Falling prices will cause some margin buyers to be forced to sell when they can no longer put up more margin, which drives prices down further.

Bubbles can be burst by regulatory action. The central bank can raise interest rates, for instance. Even just a statement by the bank that assets are overvalued could do it. But this immediately identifies who ended the bubble and opens up the authorities up for criticism. As such, this is not generally how bubbles burst.

A litany against arrogance

Having now examined history, I may be tempted to think I am immune to the kind of mass deception that characterises bubbles. This would be a mistake. If I have learnt anything, it is that bubbles are complex and subtle, and that human nature being what it is, cannot easily digest subtlety. I am human and have the same flaws. It is, perhaps, even more tempting to think that great minds (through introspection or rational deliberation) may be immune. Few would challenge the greatness of Irving Fisher, whose work pervades economics and statistics even today. In a statement now famous, 14 days before the crash, Fisher said that “In a few months, I expect to see the stock market much higher than today.” Fallibility is pervasive. There is some (cold) comfort if one recognises that markets are random, that some things cannot be explained or predicted, that knowledge is superficial at best.

Some references

An excellent account of the 1929 crash:
  • Galbraith, J. K. (1997). The Great Crash 1929. New York: Houghton Mifflin Company.
From a dynamical systems viewpoint:
  • Sornette, D. (2003). Why stock markets crash. Woodstock: Princeton University Press.
Wikipedia:
  • Wikipedia. (2012). Speculation. Wikipedia. Retrieved February 4, 2012 from http://en.wikipedia.org/wiki/Speculation
  • Wikipedia. (2012). Dot-com bubble. Wikipedia. Retrieved February 4, 2012 from http://en.wikipedia.org/wiki/Dotcom_bubble
  • Wikipedia. (2012). Economic bubble. Wikipedia. Retrieved February 2, 2012 from http://en.wikipedia.org/wiki/Economic_bubble

2012/01/31

Don’t look at my crystal ball: predicting crashes

Stock market crashes seem to hit with a ferocity and suddenness that suggests we cannot possibly predict their occurrence. With previous crashes, including in 1929, there have been those who argued that a crash was coming because speculation could not be sustained. In “Why stock markets crash: critical events in complex financial systems” Didier Sornette argues that he has found a scientific way to predict crashes.

Heisenberg uncertainty for markets

The problem with predicting stock market crashes is that prediction changes the market. If you make your prediction public, either
  1. very few people believe you and the stock market crashes on its own, or it does not crash because your prediction was wrong; or
  2. a large number of people believe you. They get out of the market or worse, go short. The prediction causes the crash; or
  3. a sizeable number of people believe the prediction may be correct. They adjust. Rather than crash, the market merely wanes. The prediction prevents the crash.
Such a prediction has very little hope of being credible. If the market crashes either you caused the crash, or you were probably just lucky. Preventing the crash, a social good, necessarily destroys your credibility. The only way to make a prediction, then, is to do so in secret. Leave the prediction with a notary who will reveal it after the fact. This is what Sornette did.

There seems to me to be another problem with prediction and that is with the methods used. If you choose to publish your method, this is essentially the same as making very many future predictions public, provided of course people actually use the model. In this case, either the model becomes a good approximation of reality or, quite the opposite, it fails to predict crashes because people adjust correctly whenever the model predicts a crash will occur. The former case is likely to be unstable. It will create a pattern from which traders could profit.

In any case, if you want to make money from your model, you should probably keep it secret. And Sornette has done this as well, not publishing his latest models. The ones I relate here were probably published with some delay.

The mathematics

Sornette tries very hard to describe his models without heavy mathematics and to explain things in a way that a lay man would understand. He fails miserably in this task. With the talk of spontaneous symmetry breaking, goldstone modes, and log-periodic behaviour (concepts from physics and dynamical systems), I was entirely lost. I am no physicist, but I consider myself to be a sophisticated reader and I got no more than the gist of things.

Sornette’s method is based on identifying the log-periodic signature associated with a speculative bubble. Such a bubble, characterised by rapidly rising prices, must eventually burst or wind down. Prices cannot continue to rise at a super-exponential rate forever, as then they will reach infinity in a finite amount of time. There is a point in time at which a crash is then most likely to occur and this is what Sornette tries to find.

Inherent in this is the idea that there is something special about a crash, and the events that precede it. Crashes are not just price drops on a larger scale. They have special properties. If this were not the case, prediction would be impossible.

Here is a horribly simplified version of the model (which I will present without a proper justification for why markets should follow such a pattern). We can suppose that during a speculative bubble the logarithm of prices follows, roughly, a power law of the following form

log(P(t)) = A + B(tc – t)D

With 0 < D < 1 we see that the gradient of the function becomes infinite at tc and the log-price reaches a maximum value of A at this point. tc is the most likely point for the bubble to burst and a crash to ensue. However, the crash can occur earlier and it need not occur at all, if prices wind down more gently. The figure plots one example of such a power law for the 1987 crash with tc = 87.65.

The above figure plots the power-law formula as fitted for a period just before the 1987 crash of the Dow Jones index. (Created using Wolfram Alpha)
Ad absurdum

It is one thing to predict stock market crashes. When the economy is in a speculative frenzy, there are always a few sober individuals who realise it cannot last. It is another thing to predict the course of world events. Sornette applies his techniques to population statistics and other figures to conclude that something, the singularity, is going to happen around 2050. What will it be? Who knows? Sornette provides some fluffy speculation. I suspect this last chapter was added merely to increase sales and should not be taken seriously.

Track record

Sornette reports a small number of actual predictions (made before the events took place). Five crash predictions were made. Two were false alarms, and two (or three, depending on how loosely you define ‘crash’) were successes. This is, of course, a terribly small sample. But even predicting two crashes correctly is something. One can do some math to say whether it is really significant (and Sornette does), but I mistrust such endeavours. Needless to say, I need more convincing.

What is the use?

You can do two things with your ability to predict crashes. You can make money, or at least avoid losses, and you can help prevent future crashes. If people believe the model works, when a crash seems likely to be coming, speculation should slow. The market could become more stable (in fact, it is not clear that it might not rather cause the opposite). Authorities could use the model to decide when to step in. The problem is, if this works, the model will now be a bad predictor of crashes.

It is also precisely when action is needed the most when the model is least likely to be trusted. In a speculative orgy, people want to believe the good times will continue. The model would have failed before. Perhaps it is wrong this time too. I do not believe the Sornette model is likely to have this effect, merely because it does not appear to have been widely adopted. Even if crashes do not occur as predicted by the model, this does not mean they will not occur. They may develop a new pattern, one the model cannot account for.

Final word

Stock market prediction is a perilous business. At best it is imprecise, unreliable. At worst it attracts charlatans and those who would manipulate markets for their own ends. In the midst of a speculative frenzy it seems that we should know better; we should know things cannot last. We seem to be unwilling to predict the end. We can neither trust our models nor our instincts. The former are too simple, the latter too susceptible to fallibility.

References

Sornette, D. (2003). Why stock markets crash. Woodstock: Princeton University Press.

2012/01/26

Blink and trade

I just finished reading the (highly recommended) book Blink by Malcolm Gladwell. It is about those decisions humans can make instantaneously, without conscious thought. It’s about when this works extremely well, and when it fails, sometimes with horrible consequences. My own decisions are the opposite of snap judgements. I consider everything with extreme care, perhaps too much care. Traders often do not have that luxury, especially not, I think, pit traders. What interests me then, is to what extent traders rely on snap judgements and is this a good thing?

Traders, war games and money

Gladwell relates a tale about General Van Riper, at a time when the US government was conducting very expensive war games. Van Riper thought there was something to be learnt from trading, and so the army played some trading games. What is more, he took some traders to play war games and found that they were very good. They were able to make the rapid assessments under high pressure that were needed. It was clear that the army and traders were “fundamentally engaged in the same business – the only difference being that one group bet on money and the other bet on lives.” George Soros, reportedly, owes much of his success to this kind of instinctive decision-making. His back starts to hurt and he changes his market position.

The good, the bad, the ugly

Blink decisions can be very good. They avoid over-analysis. They allow people to react within the necessary amount of time. And they can, under the right circumstances, be as good or better than decisions made with careful and tiresome deliberation.

The problem, of course, is getting those right circumstances. Snap judgements can fail horribly, such as when a policy officer shoots an unarmed suspect, seeing a gun that was never there. But such snap judgements can also allow you to avoid getting killed. In general, experience and practice, allow for better snap judgements. Is it thus possible for traders to get a feel for the markets based on their experience, a sense, a tingling, that they cannot perhaps explain, that allows them to avoid losses or make profits?

The problem is that markets are so very random. The information a trader sees is peppered with irrelevancies. There is, perhaps, no pattern. Our brains are very good at sifting through information and focussing on what’s really important. But it can also get fooled. I am not sure whether the markets are more likely to fool the brain or not. All the evidence for biases in human decision-making would suggest caution is warranted.

It is usually thought that deliberated decisions should be at least as good as snap judgements. This is often not the case. We can get swamped by information. We make errors because we cannot identify what is truly relevant. We get distracted by things we might be better off not considering. In the markets, more information is not necessarily better. Much of it is irrelevant, meaningless, in any case.

Snap judgements, of course, cannot be scrutinised. The mechanisms behind them are hidden from our conscious minds. We cannot, rationally, justify them. “I had a feeling,” is not a good enough explanation for entering a trade that lost a lot of money. And, even if some traders were good at making such snap decisions, not all of them would be. It might be hard to distinguish them.

Final word

I do not think this is a topic which has been much studied. I can, therefore do little but pose some interesting questions. Are trader snap judgements good? Can they be improved with training or by changing the environment in which those decisions are made (such as limiting the information a trader sees)? Should traders rely more or less on snap judgements?

Reference

Gladwell, M. (2005). Blink. New York: Little, Brown and Company.

2012/01/24

Markets as complex systems

Markets are driven by people (and, lately, algorithms). Their decisions (driven by their motives) drive prices. However, economic theory has had little to say about how these interactions ‘add up’ to give the aggregate market dynamics we observe. It is a convenient excuse to say that markets are efficient, and so what we observe must be because of news events, which people immediately react on and incorporate in prices. This seems a little fanciful. We may consider instead what some have called the interacting agents hypothesis, which says that we can explain (inefficient) market behaviour by looking at the aggregation of individual interactions. I recently examined a class of models based on dynamical systems theory that does just this.

What we are trying to explain

In virtually all markets a number of stylised facts have been found. The ones that contradict the standard model of financial markets (the random walk model) have often been called anomalies, as if they are aberrant and infrequent. They are not. It is the standard model that is aberrant. Here are the things I mean

Unit roots

Standard tests of whether markets follow a random walk (whether they have a unit root) are unable to reject it. This would, on its own, seem to confirm the standard model. However, there is ample other evidence of market behaviour to reject it. That these standard tests thus still give this result is very interesting.

Fat tails

Market returns exhibit fat tails. Technically, it means that they have a distribution with a high kurtosis. This means that very large price movements as well as negligible price movements occur more frequently than the standard model would predict. A very interesting feature of the returns distribution is that the fat tails are observed for daily returns, but monthly and yearly returns appear to be approximately normal. One could argue that even daily returns are made of thousands of intra-daily returns – if these followed the standard model, the daily returns would have a normal distribution by the central limit theorem. Why is it not applying, or why is it acting so slowly? The interacting agents models attempt to explain it by including dependencies between agents (remember that the central limit theorem needs independent observations).

Volatility clustering

The market has periods of relative calm interspersed with periods of highly volatile prices. The autocorrelations absolute returns (and to lesser extent squared returns) is high. Markets are well-behaved most of the time, but sometimes something happens....

Dynamical systems

Dynamical systems theory, also known as chaos theory is a branch of mathematics that looks at the interactions of many particles. Non-linear interactions (even if each particle behaves according to a relatively simple set of rules) can result in surprisingly rich behaviour of the system as a whole, know as emergent properties. I have mentioned chaos theory before because it naturally leads to power law behaviour. These systems may have infrequent but sudden transitions, corresponding to critical points (or singularities) where the system makes a transition from disorder to order. Such properties may explain the relative calmness of markets most of the time, interspersed with periods of volatility.

The models

The models I have looked at use two kinds of agents, chartists and fundamentalists. The former are technical analysts, trend followers. They are supposed to exaggerate market movements. The latter believe the market will return to its fundamental price. They are supposed to have a stabilising effect on prices as they buy when prices are below fundamental value and sell when they are above. I have written about these investment philosophies before.

The basic mechanism of these models is imitation. Chartists may be optimistic (buyers) or pessimistic (sellers). This mood (of optimism or pessimism) can spread from trader to trader like a virus. As such it can be called contagion, infection, or herding. This is a simple way of modelling trader psychology. There is a force that results in people getting on the bandwagon. And the more people there are on already, the stronger the force. This is not necessarily irrational. It makes sense to look at the opinions of your peers as this provides information (especially if you do not have other information). For traders it may be very important not to underperform the rest of the market (as this may get them fired). The surest way to prevent this from happening is to follow the crowd.

As long as people have different opinions, i.e. no one group of traders dominates, the market is in a state of disorder. Participants' actions tend to counteract each other and the market is stable. When any one group dominates order is created in the market. Many traders agree and take the same action. Their actions reinforce each other and in the case of a dominance of optimistic (or pessimistic) noise traders, exaggerate market movements away from the fundamental value. It is the actions of fundamental traders, who then act on the mispricing, that drives the prices back toward fundamental value. These models thus explain intermittent waves of optimism and pessimism. The data generated appear to fit the stylized facts.

Caveat

Dynamical systems models are analytically intractable. We need to be happy with either grossly oversimplified models or else only approximate or simulated results. Even the more complicated models are a drastic oversimplification of reality. They may provide a useful explanatory tool, but applying them in a useful way, may still be a way off. Although I have heard of trading being done with chaos theory models, I do not know what form they take. There is certainly a lot interesting research that can still be done.

One important point that must be made is that these models do not (and cannot) prove that the efficient markets hypothesis (EMH) is incorrect. In fact, none of the stylized facts I mentioned contradict the EMH (they do however contradict the far stronger notion that markets follow a random walk). Human behaviour, at least, is partly observable (maybe even quantifiable) whereas the supposed news process driving fundamental prices is far more ethereal. If the source of market turmoil is primarily from trader behaviour, then we may hope to curtail it by appropriate policies and education. However, very little can be done if it follows from fundamental processes.

Disclaimer

I do not fully understand the models I have written about myself. I do not (yet) have the necessary mathematical knowledge. If you want to know more please see the essay I wrote which gives a more in depth discussion and references.

References

Please see my essay on this topic.

2012/01/22

Imaginary Alpha

Alpha is what hedge funds sell. It is the skill of the investment manager(s), allowing them to earn a higher return than justified merely by the amount of risk they take. In practice this means earning more than a simple index fund. For this excess return, hedge funds charge higher fees. Presumably this is justified. In an efficient market alpha would be zero – there would be no way to earn (on average) higher returns than the market as a whole. No one (except economists and some MBA students) believes markets are efficient anymore. However, since 1998, hedge fund clients (in the US) have earned on average only half the rate of return on treasuries.

Self-selection bias

Indices of hedge fund performance suffer from a crucial flaw which make them (in my opinion) all but useless. Reporting to the indices is voluntary. And as such only hedge funds that perform well will start to report. Those that perform badly will stop reporting. The indices thus overstate hedge fund returns.

It has been argued that this may well be offset by the fact that the top-performing hedge funds may also choose not to report. They may do so because they have already raised enough capital or because they no longer need the exposure.

It would, however, appear that the latter effect is far smaller than the former, making any studies based on this data (which is most studies up to this point) suspect.

Damnation

A recent study by Aiken, Clifford and Ellis indicates that hedge fund alpha may well be much lower than previously thought. They find that, in fact, most of the alpha of hedge funds is explained by their decision to report (or not) in the commercial indices. In order to get past the self—selection problem they use the figures of funds of funds registered with the Securities and Exchange Commission. These funds invest in other hedge funds, whose returns can thus be scrutinised.

Funds that stop reporting afterward have dramatically lower returns than those that continue. The delisted funds continue to operate for some time and contribute zero alpha. This would still mean a positive alpha for hedge funds overall, but smaller than given by only examining the reporting funds.

Why not invest only in funds that do report returns? The hedge fund sector is illiquid – it takes time to get your money out. There is also a lag in the reporting of returns. An investor cannot be sure that a hedge will report its most recent returns.

Another problem (not tackled by the paper) is that some funds may perform well when they are small, which allows them to attract more money. This performance may or may not be simply due to luck. However, when (not if) the fund performs badly, its cash losses may well exceed all previous gains, simply because it now has more money. Investors, on average, lose out.

The above can be applied to the industry as a whole. When it was small, it was making high returns, and attracted capital from various sources. However, the losses in 2008, may have wiped out all cumulative gains in the industry going back ten years.

Caveats

The Aiken, Clifford and Ellis paper does suffer from flaws and these should be considered when evaluating the results. For instance, the period studied is from 2004 to 2009. It may be that a longer time period (or a future time period) gives different results. There is at least one study that finds no evidence of a selection bias due to the fact that funds that perform well may choose to stop reporting after having raised sufficient capital. The Aiken, Clifford and Ellis study itself has a selection bias, in that it only examines hedge funds that are invested in by funds of funds reporting to the SEC. The authors do, however, perform various tests which suggest that this results in no systematic errors. The statistical methods used are based on normal theory and as returns patently do not follow normal distributions, results should be treated with some scepticism. However, this latter point applies to most financial papers.

The dilemma

Hedge fund managers earn very large fees. They have done so, despite that their clients have walked away with meagre returns. This raises the question of whether the alpha displayed by some managers is anything more than mere luck. People have trouble believing in luck. They attribute high returns to skill. This is good for hedge fund managers, but it may be very bad for investors.

Some references
  • Aiken, A. L., Clifford, C. P., & Ellis, J. (2010). Out of the dark: Hedge fund reporting biases and commercial databases. Finance.
  • The Economist. (2012a). Hedge fund returns: More damning data. The Economist. Retrieved January 21, 2012, from http://www.economist.com/blogs/buttonwood/2012/01/hedge-fund-returns?fsrc=scn/fb/wl/bl/moredamningdata
  • The Economist. (2012b). Rich managers, poor clients. The Economist. Retrieved January 21, 2012, from http://www.economist.com/node/21542452
  • Wikipedia. (2012). Alpha (investment). Wikipedia. Retrieved January 21, 2012, from http://en.wikipedia.org/wiki/Alpha_(investment)

2011/10/23

"Just a little longer": the curse of finite capital

Warning: this post contains some mathematics. However, non-technical readers may ignore the equations and focus on the concepts, which are far more important in any case.

One thing that hit me about LTCM’s failure is this: they failed not because their models were wrong, but because they ran out of capital. I came across a simple mathematical example of a strategy which illustrates a strategy that runs out of capital and will share it with you.

The double or nothing strategy

We consider a discrete time market which is both fair and efficient. There is, however, a way of making a guaranteed profit. What is the catch? You need an infinite amount of capital.

Consider the shares of Fairness Company. The company has an equal (and independent) chance of doing well (in which case the share price goes up) or poorly (in which case it falls) every period. We take out a derivative which pays 2 if the shares go up and 0 if they go down in the next time period. Naturally, the cost of one unit of this derivative is 1, the expected gain. So if we buy one unit of this derivative we will make a profit of 1 with probability ½ and a loss of 1 with probability ½. The expected profit is zero.

Let us call the profit on the derivative at time t (which we buy at time t-1) dt. So


Suppose we hold Yt units at time t, which we buy at time t-1 and we start off by buying one derivative. So with probability ½ we gain or lose Yt units at each period. Our accumulated loss/gain at time n is then


If the share goes up after the first period, we stop and get a profit of 1. If it goes down we bet more, so that when the share does go up we recover our loss and make a profit. That is we invest 1 (our original holding), plus what we lost, also 1. So we invest 2.

So we set


It is important that Yn depends only on n-1, which is something we already know when we buy our next set of derivatives.

Note that if dn = 1 then

and Yn = 0. So we naturally stop when we make a profit.

If we do not make a profit, but a loss, we get


So for our next bet we need to invest


So after each period we double our bet, as long as we are losing. Let us call the time when we stop T.


T is finite with probability 1. Which can be seen because


Adding up for all n gives


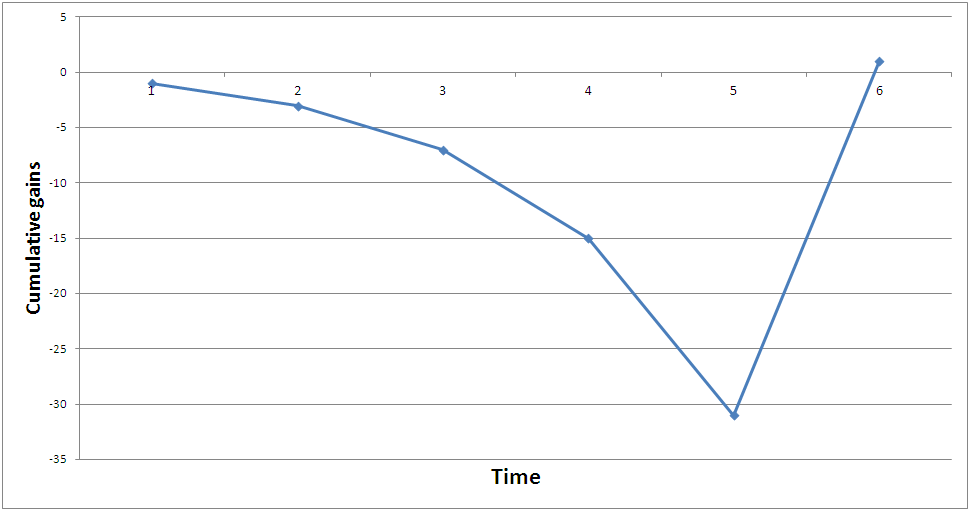
So eventually the strategy will stop and you will get your guaranteed reward of 1. An example of how this happens is shown in the following graph. Note how large your losses become before you eventually make your (by that time miniscule) profit.


But how much money should you have, exactly?. Well your last bet has value

and the expected amount you need, just for this last bet, is then


The moral

This example is, of course, very simple and somewhat contrived. It does illustrate one salient point: A strategy that must “eventually” work can fail if you cannot stay solvent long enough to see it through.

In this case the problem is, of course, that the market is fair. If markets actually are fair you cannot beat them. Another reason your strategy may fail is because of market irrationality. The market may be completely irrational in the short term. LTCM was waiting, quite reasonably, for the prices of Royal Dutch and Shell to converge (they WERE shares in the same company after all). However, they just did not have the ability to wait long enough.

Doubling your bet at each period may seem insane, but there are many investors out there who believe that if a stock they hold goes down, this is a sign to buy even more of it as it is now even more undervalued. Of course, if markets are mean-reverting and the stock truly is undervalued then this may be legitimate.

The problem comes when you borrow in order to buy the stock, then you may be expected to repay your debt before your profits have come. And no one has unlimited borrowing capacity.

Never devise a strategy without considering how much capital you might need. Never assume that you will not need to make a (dis)graceful exit. I leave you with the words of John Maynard Keynes, whose wisdom mocks us even today:

"Markets can remain irrational a lot longer than you and I can remain solvent."

Some references

  • Spreij, P. J. C. (2011). Measure Theoretic Probability. Retrieved from http://sites.google.com/site/mtp1112/mtp.pdf?attredirects=0
  • Wikipedia. (2011). Long-Term Capital Management. Wikipedia. Retrieved from http://en.wikipedia.org/wiki/LTCM

2011/10/10

Pair Trading: a two-horse bet

Pair trading is a very popular strategy in quant finance. This is a simple form of statistical arbitrage that relies on there being some link, on average, between the prices of certain stocks. Of course, this assumes that markets are not efficient.

The basic idea

Pair trading involves buying one stock and selling (going short) another stock. Essentially this is a bet on one stock vs another stock. For simplicity, suppose we buy one share of X and sell one share of Y at the same price, so we have a net position of zero. At any point in time our profit is X – Y. So we are hoping that the gap between X and Y share prices will increase. Note that it does not actually matter if the market falls or goes up. Both X and Y can go down and we will still make money if Y goes down more. Conversely both X and Y can go up and we can lose money if Y goes up more. We need some means of deciding on two stocks to trade, a means of predicting in what direction they will move relative to each other and also some means of deciding when to exit the trade.

Pair traders often search for pairs of stocks that tend to move together. Say we find that when stock X goes up, stock Y tends to go up as well. That is they are positively correlated. The basic assumption behind pair trading is that if this relationship should break down temporarily, say stock Y tumbles a bit and X is not affected, the market will move in such a way as to restore the relationship. This is one form of mean reversion. If there is some long-term average spread between the prices of stocks X any Y we would expect any deviation from it to be only temporary. That is, we would expect stock Y to go up (relative to X) in order to restore the balance. So we would go long (that is, buy) Y and short (that is, sell) X. When the spread has returned to its average level we can end the trade.

The two companies traded are often in the same sector, say they are both widget makers. Companies in the same sector tend to experience the same risk factors and react to the same news and so their shares are correlated. Of course we do not only need to look for some average spread. If one has reason to believe that, say, Ford will outperform General Motors (because it more innovative, perhaps), one can short General Motors and go long Ford.

Market neutral

Pair trading is one of a class of strategies called market neutral. This means that it (should) make profits (or losses) that are uncorrelated with the market. This means it should be able to make profits (or losses) whether the market goes up or down. In the Ford/GM example, it does not matter how the car industry performs (both shares can do terribly or extremely well) or even the market as a whole. All that matters is whether you were right that Ford would outperform GM.
This can be contrasted with another common, non-quant strategy, of buying an index fund, which mimics the market. This strategy is 100% correlated with the market. Whatever the market return, that is what you get.

Pros

  • Risk is reduced by reducing dependence on market movements. Profit can be made in any market conditions, even where the market or the sector you are looking at crashes.
  • The strategy is self-funding. In principle, the short trade can be used to finance the long trade.
  • There is lots of data available for finding pairs to trade and this can (and is) done algorithmically.

Cons

  • Of course, there is a risk that your bet is wrong. Essentially, you have exchanged market or sector risk for a new risk. If the securities move in the opposite direction (relative to each other) to that you assumed you will lose money.
  • In a trending market you will always lose money on one half of your trade. If you trade two technology stocks, say, and technology has a good period, both stocks may go up substantially, whereas the spread between them may remain small. You could have made more money by buying both stocks, or just one. However, now you lose money on the stock that you shorted.
  • In the above cases and where deviations from long-term spreads are not very large, the strategy will only result in moderate profits (if any).
  • If you analyse enough data, you WILL find a pair of correlated stocks. This correlation may be spurious (that is, illusory). Correlations and spreads between stocks change. Using the past to predict the future is always a risky business.
  • In a small market, there may not be enough truly correlated stocks for pair trading to be a strategy worth pouring much capital into. Notably, in South Africa only the top 40 stocks are usually considered by large funds.
Pair trading that went wrong

A notable pair trader was the fund LTCM, back in the 90’s. The petrol company Royal Dutch Shell had shares listed on two exchanges. One set of shares was for Shell, the other for Royal Dutch. However, Royal Dutch traded at a nearly ten percent premium to Shell. This is strange because these represent identical claims on the same company – common sense dictates they should have the same price. LTCM assumed the premium would disappear: they sold Royal Dutch and bought Shell.

All LTCM had to do was wait for the prices to converge. Unfortunately, that is exactly what it could not do. The premium widened to 22% in a short period. LTCM was forced to close its positions because of lack of liquidity in its other operations. It lost more than $100 million dollars on this trade alone.

Some references

Pair trading

  • Goodby, D. (2008). A Basic Introduction to Pairs Trading. TradingMarkets.com. Retrieved from http://www.tradingmarkets.com/.site/stocks/how_to/articles/-76543.cfm
  • Investopedia. (2011). Pairs trade. Investopedia. Retrieved from http://www.investopedia.com/terms/p/pairstrade.asp#axzz1Zkm97SeJ
  • Junge, C. (2011). A simple pair trading example. www.christoph-junge.de. Retrieved from http://www.christoph-junge.de/pairstrading.php
  • Preston, T. (2005, November). Pairs Trading. Traders Mag, 40 - 44. Retrieved from http://www.google.nl/url?sa=t&source=web&cd=1&ved=0CBwQFjAA&url=http%3A%2F%2Fmediaserver.thinkorswim.com%2Farticles%2FTPPairsTradingArticle.pdf&ei=ZMqSTsj_Ds3sOf6mzKgO&usg=AFQjCNET8DDNLyk7rI_RTsymC5opuBvbng&sig2=OsjJCEKVGDyDJEgAdj2QUQ
  • Skiena, S. (2008). Lecture 23: Pairs Trading. Retrieved from http://www.cs.sunysb.edu/~skiena/691/lectures/lecture23.pdf
  • Stone, C. (2011). The Secret to Finding Profit in Pairs Trading. Investopedia. Retrieved from http://www.investopedia.com/articles/trading/04/090804.asp#axzz1Zkm97SeJ
  • The Hedge Fund Guide. (2011). Pair trading. www.thehedgefundguide.com. Retrieved from http://www.thehedgefundguide.com/pairstrading.html
  • Wikipedia. (2011). Pairs trade. Wikipedia. Retrieved from http://en.wikipedia.org/wiki/Pairs_trade

LTCM

  • Wikipedia. (2011). Dual-listed company. Wikipedia. Retrieved from http://en.wikipedia.org/wiki/Dual-listed_company
  • Wikipedia. (2011). Long-Term Capital Management. Wikipedia. Retrieved from http://en.wikipedia.org/wiki/LTCM