2013/08/28

Stop confusing clever with lucky

I get very annoyed when I see idiotic journalism, such as this article (admittedly Business Insider does not exactly maintain high standards of journalism, but in this case they just copied CNBC). To recap: one 22-year old kid put all his savings into Tesla shares (and later options on Tesla shares) and today has made quite a hefty profit. But when his friends told him he was crazy, they were right.

It is stupid to present this kid’s outstanding luck as success. He was not successful – he was blindly, stupidly, and ignorantly lucky. There was absolutely no way of knowing that Tesla would outshine all the other technology companies. There must be thousands of investors who have similarly bet heavily in some particular stock and found themselves losing everything. I am, of course, not saying anything new here. Taleb argued just these lines in his book Fooled by Randomness, which everyone should read.
But we don’t hear about the investors who lose everything. We only hear about the ones who strike it lucky. Because we think they are special, that they had some special foresight. Mostly they were just lucky.

I admit that markets are not efficient. Some people may have the ability, through research, to increase their chances of doing well. Most active managers think they have this ability (and all of them claim to have it). But only the stupid ones would invest most of their capital in one stock. There is too much room for error.

Warren Buffett is often cited as an example of an investor that managed to beat the market with his foresight, and this may be true (considering his long track record). But he was also very lucky. When he was just starting he invested 75% of his worth in one stock, GEICO, which paid off handsomely. This was after just one conversation with an executive there (one who became CEO shortly afterward). Buffett was extremely lucky. If that single investment had not paid off (and how do you really know it will pay off after speaking to one person, who can’t control the direction of the entire company?) we would never have heard the name Buffett.

Taking stupid risks is fine if you have a safety net (for instance rich parents), because then you’re not really putting all your eggs in one basket. For the rest of us: ignore the media when it tells you people who risked everything were smart. They were lucky.

References

  • Buffett, W. (2010). Letter to the shareholders of Berkshire Hathaway Inc. October. Retrieved from http://www.berkshirehathaway.com/letters/2010ltr.pdf
  • Lebeau, P. (2013). College Student Put His Life Savings Into Tesla, Made A Killing. Business Insider. Retrieved August 28, 2013, from http://www.businessinsider.com/college-student-put-his-life-savings-into-tesla-made-a-killing-2013-8
  • Taleb, N. N. (2007). Fooled by Randomness (2nd ed.). Penguin.

2013/08/10

Volatility weighting primer

Volatility weighting is one common means of attempting to improve the risk profiles of strategies, that is to give them smoother returns. It consists of taking some asset (or the returns from a strategy) and dividing the investment you make by the (estimated) future volatility of the strategy. The goal of this is in fact not reduce the volatility of returns, per sé, but rather the volatility of volatility. In practice it seems that volatility weighting does seem to work and gives higher Sharpe ratios (a measure of the amount of return for every unit of risk taken).

Some simple maths (skip this bit if you fear maths)

Consider for instance an asset with returns
with (for simplicity) sigma σ and epsilon ε independent and epsilon ε is mean zero with variance 1. Here σ represents the volatility of the process. It is predictable (the value for the next period is known today) but it is random – it changes from period to period. The Sharpe ratio of this strategy is
Notice that this ratio is maximised if volatility is deterministic, that is if the coefficient of variation of volatility
is zero. Making volatility deterministic is, in this case, exactly what volatility weighting does.


What we need for volatility weighting to work

  1.  To be able to forecast volatility. It is typical to model volatility as a predictable process, but in practice we cannot even observe volatility directly. There is, however, some evidence that volatility is sticky, so that one can predict it to some degree.
  2. We need the portion of returns not depending on volatility not be too large. If this is not the case, then we do not have the multiplicative nature of the return series. It does, however, seem that the effect of this portion of returns is not so large as to completely invalidate the use of volatility weighting.

Why volatility weighting works

  1.  I have already mentioned that there is an effect of stabilising the volatility and that this creates a more stable returns series. In particular we saw earlier that volatility weighting seems to work by reducing the coefficient of variation of volatility.
  2. There is, however, another possible effect, volatility timing. If returns are negatively related to volatility then volatility weighting will mean investing less when volatility is high and more when it is low, which intuitively seems to be a good strategy. This won’t work if the conditions in the previous section are not met, though.
It is not clear which of the above two effects is more important in practice, or if they can even be separated in any meaningful manner. It is clear, though, that volatility weighting can work even where the relationship with volatility is positive (so the second effect is not then the most important). It is also true that for some strategies, for instance momentum, the relationship with volatility is often negative and so we can expect the timing effect to play a role as well.

Own volatility or underlying volatility

There are many ways to do volatility weighting. Here are two that I have looked at:

  1. Weighting a strategy by its own volatility: you look at some investment strategy and estimate its volatility in some form and then scale how much you invest in the entire strategy.
  2. Weighting the underlying assets: Here you consider some investment strategy based on a set of assets. Now replace the assets with a set of assets that have been volatility weighted. I call this using normalised returns. 
Both of the above forms of volatility weighting appear to be effective, the latter probably more so.

2013/08/05

Momentum strategies

Momentum is an age-old feature of financial markets. It is perhaps the simplest and also the most puzzling of the “anomalies” discovered.  It is simply the tendency for assets (for example shares of some company) that did well (or poorly) in the past to continue to do so for a time in the future. It has been extensively examined in academia and has been found to be present in virtually all markets and going as far back as we have data. It has even persisted some decades after being extensively investigated for the first time. And still, it seems, we do not understand it very well. In today’s post I just want to highlight some different momentum strategies and their uses.

A property and a strategy

Momentum is a property of asset prices in markets and momentum strategies try to benefit from this property. One way of understanding momentum is to consider different momentum strategies and the profits they make, which gives an indirect means of understanding how asset prices work. For investors, of course, this is perhaps the most convenient way to study momentum as they are inherently interested in the strategies. They only care about momentum as a property if they can exploit it. The distinction between momentum as a property and as a strategy is not always clear because academics have not yet, I think, deemed it important to make the distinction explicit and thus both are simply called momentum. 

How to construct a momentum strategy

Momentum strategies come in all shapes and forms. Basically all of technical analysis is some kind of momentum strategy. A very general way of thinking about constructing a momentum strategy is depicted in the picture below. One starts by identifying some kind of trend (or signal) for each of the assets you are considering. This gives the direction of the momentum for the asset (for instance up or down). One can then assign a strength (or score) to this signal, which can be related to the magnitude of the momentum or the confidence you place in it. Then based on the signal and strength one makes an allocation decision – you decide how to bet in order (hopefully) to profit.


Time-series and cross-sectional momentum

Momentum strategies come in two main forms (though they are related). The first is to consider momentum for individual assets – the tendency for an asset’s price to go up if it went up in the past.  Here the signal and strength are evaluated for assets in isolation. This is time-series momentum. This form of momentum can be contrasted with cross-sectional momentum, which considers the momentum of assets relative to each other, e.g. the tendency of one asset to perform better than other assets if it also did so in the past, for instance. Here the signal and strength depends on how assets compare to each other.

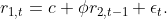
Time-series momentum (strategy) tends to do well if an asset’s return is related positively related to its own past (property), for instance in what is called an AR(1) process:


Thus a higher return in the past predicts a higher return in the future.

Cross-sectional momentum (strategy) tends to do well if one asset’s return is negatively related to the past return of another asset (property), for instance if (numbering the assets 1 and 2)


This means that a high return on the one asset predicts a lower return for the other asset in the future.


Some simple strategies

Here are some simple strategies, based on a simple taxonomy:

Signed time-series momentum: buy any asset that went up in the past; sell any asset that went down.

Signed cross-sectional momentum: this is analogous to the above, but now invest in deviations from the average return or the market return. For instance the deviation of asset i’s return from the average is


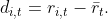
If the asset did better than the average, buy the asset and sell the market and do the opposite if it did worse. This is a bet that assets that had above average performance in the future will continue to do so in the future.

Linear time-series strategy: again buy any asset that went up and sell any asset that went down, but invest more in assets with larger returns (invest proportionally to the asset’s past return)

Linear cross-sectional strategy: the same as above, but for deviations from the average (or market) return.

Quantile cross-sectional strategy: buy, for instance, the top third of assets and sell the bottom third.


In practice only the signed time-series and quantile cross-sectional strategies are used. The other strategies are, however, useful in formulating theory. For instance the linear strategies are easier to cope with mathematically, but amplify volatility too much to make them useful in practice.


Some references


My thesis:
  • Du Plessis, J. (2013). Demystifying momentum: time-series and cross-sectional momentum, volatility and dispersion. University of Amsterdam. Retrieved from http://www.johandp.com/downloads/johandp_momentum_final.pdf?attredirects=0
Some empirical articles looking at momentum strategies:
  • Jegadeesh, N., & Titman, S. (1993). Returns to Buying Winners and Selling Losers: Implications for Stock Market Efficiency. The Journal of Finance, 48(1), 65–91. doi:10.1111/j.1540-6261.1993.tb04702.x
  • Lewellen, J. (2002). Momentum and Autocorrelation in Stock Returns. (C. H. Schiller, Ed.)Review of Financial Studies, 15(2), 533–564. doi:10.1093/rfs/15.2.533
  • Moskowitz, T. J., Ooi, Y. H., & Pedersen, L. H. (2012). Time series momentum. Journal of Financial Economics, 104(2), 228–250. doi:10.1016/j.jfineco.2011.11.003