2011/10/23

"Just a little longer": the curse of finite capital

Warning: this post contains some mathematics. However, non-technical readers may ignore the equations and focus on the concepts, which are far more important in any case.

One thing that hit me about LTCM’s failure is this: they failed not because their models were wrong, but because they ran out of capital. I came across a simple mathematical example of a strategy which illustrates a strategy that runs out of capital and will share it with you.

The double or nothing strategy

We consider a discrete time market which is both fair and efficient. There is, however, a way of making a guaranteed profit. What is the catch? You need an infinite amount of capital.

Consider the shares of Fairness Company. The company has an equal (and independent) chance of doing well (in which case the share price goes up) or poorly (in which case it falls) every period. We take out a derivative which pays 2 if the shares go up and 0 if they go down in the next time period. Naturally, the cost of one unit of this derivative is 1, the expected gain. So if we buy one unit of this derivative we will make a profit of 1 with probability ½ and a loss of 1 with probability ½. The expected profit is zero.

Let us call the profit on the derivative at time t (which we buy at time t-1) dt. So


Suppose we hold Yt units at time t, which we buy at time t-1 and we start off by buying one derivative. So with probability ½ we gain or lose Yt units at each period. Our accumulated loss/gain at time n is then


If the share goes up after the first period, we stop and get a profit of 1. If it goes down we bet more, so that when the share does go up we recover our loss and make a profit. That is we invest 1 (our original holding), plus what we lost, also 1. So we invest 2.

So we set


It is important that Yn depends only on n-1, which is something we already know when we buy our next set of derivatives.

Note that if dn = 1 then

and Yn = 0. So we naturally stop when we make a profit.

If we do not make a profit, but a loss, we get


So for our next bet we need to invest


So after each period we double our bet, as long as we are losing. Let us call the time when we stop T.


T is finite with probability 1. Which can be seen because


Adding up for all n gives


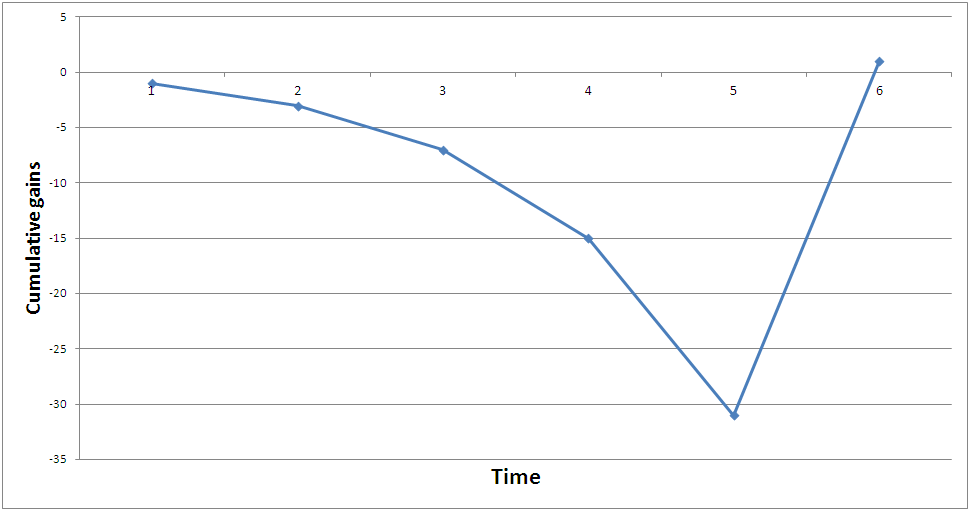
So eventually the strategy will stop and you will get your guaranteed reward of 1. An example of how this happens is shown in the following graph. Note how large your losses become before you eventually make your (by that time miniscule) profit.


But how much money should you have, exactly?. Well your last bet has value

and the expected amount you need, just for this last bet, is then


The moral

This example is, of course, very simple and somewhat contrived. It does illustrate one salient point: A strategy that must “eventually” work can fail if you cannot stay solvent long enough to see it through.

In this case the problem is, of course, that the market is fair. If markets actually are fair you cannot beat them. Another reason your strategy may fail is because of market irrationality. The market may be completely irrational in the short term. LTCM was waiting, quite reasonably, for the prices of Royal Dutch and Shell to converge (they WERE shares in the same company after all). However, they just did not have the ability to wait long enough.

Doubling your bet at each period may seem insane, but there are many investors out there who believe that if a stock they hold goes down, this is a sign to buy even more of it as it is now even more undervalued. Of course, if markets are mean-reverting and the stock truly is undervalued then this may be legitimate.

The problem comes when you borrow in order to buy the stock, then you may be expected to repay your debt before your profits have come. And no one has unlimited borrowing capacity.

Never devise a strategy without considering how much capital you might need. Never assume that you will not need to make a (dis)graceful exit. I leave you with the words of John Maynard Keynes, whose wisdom mocks us even today:

"Markets can remain irrational a lot longer than you and I can remain solvent."

Some references

  • Spreij, P. J. C. (2011). Measure Theoretic Probability. Retrieved from http://sites.google.com/site/mtp1112/mtp.pdf?attredirects=0
  • Wikipedia. (2011). Long-Term Capital Management. Wikipedia. Retrieved from http://en.wikipedia.org/wiki/LTCM

2011/10/10

Pair Trading: a two-horse bet

Pair trading is a very popular strategy in quant finance. This is a simple form of statistical arbitrage that relies on there being some link, on average, between the prices of certain stocks. Of course, this assumes that markets are not efficient.

The basic idea

Pair trading involves buying one stock and selling (going short) another stock. Essentially this is a bet on one stock vs another stock. For simplicity, suppose we buy one share of X and sell one share of Y at the same price, so we have a net position of zero. At any point in time our profit is X – Y. So we are hoping that the gap between X and Y share prices will increase. Note that it does not actually matter if the market falls or goes up. Both X and Y can go down and we will still make money if Y goes down more. Conversely both X and Y can go up and we can lose money if Y goes up more. We need some means of deciding on two stocks to trade, a means of predicting in what direction they will move relative to each other and also some means of deciding when to exit the trade.

Pair traders often search for pairs of stocks that tend to move together. Say we find that when stock X goes up, stock Y tends to go up as well. That is they are positively correlated. The basic assumption behind pair trading is that if this relationship should break down temporarily, say stock Y tumbles a bit and X is not affected, the market will move in such a way as to restore the relationship. This is one form of mean reversion. If there is some long-term average spread between the prices of stocks X any Y we would expect any deviation from it to be only temporary. That is, we would expect stock Y to go up (relative to X) in order to restore the balance. So we would go long (that is, buy) Y and short (that is, sell) X. When the spread has returned to its average level we can end the trade.

The two companies traded are often in the same sector, say they are both widget makers. Companies in the same sector tend to experience the same risk factors and react to the same news and so their shares are correlated. Of course we do not only need to look for some average spread. If one has reason to believe that, say, Ford will outperform General Motors (because it more innovative, perhaps), one can short General Motors and go long Ford.

Market neutral

Pair trading is one of a class of strategies called market neutral. This means that it (should) make profits (or losses) that are uncorrelated with the market. This means it should be able to make profits (or losses) whether the market goes up or down. In the Ford/GM example, it does not matter how the car industry performs (both shares can do terribly or extremely well) or even the market as a whole. All that matters is whether you were right that Ford would outperform GM.
This can be contrasted with another common, non-quant strategy, of buying an index fund, which mimics the market. This strategy is 100% correlated with the market. Whatever the market return, that is what you get.

Pros

  • Risk is reduced by reducing dependence on market movements. Profit can be made in any market conditions, even where the market or the sector you are looking at crashes.
  • The strategy is self-funding. In principle, the short trade can be used to finance the long trade.
  • There is lots of data available for finding pairs to trade and this can (and is) done algorithmically.

Cons

  • Of course, there is a risk that your bet is wrong. Essentially, you have exchanged market or sector risk for a new risk. If the securities move in the opposite direction (relative to each other) to that you assumed you will lose money.
  • In a trending market you will always lose money on one half of your trade. If you trade two technology stocks, say, and technology has a good period, both stocks may go up substantially, whereas the spread between them may remain small. You could have made more money by buying both stocks, or just one. However, now you lose money on the stock that you shorted.
  • In the above cases and where deviations from long-term spreads are not very large, the strategy will only result in moderate profits (if any).
  • If you analyse enough data, you WILL find a pair of correlated stocks. This correlation may be spurious (that is, illusory). Correlations and spreads between stocks change. Using the past to predict the future is always a risky business.
  • In a small market, there may not be enough truly correlated stocks for pair trading to be a strategy worth pouring much capital into. Notably, in South Africa only the top 40 stocks are usually considered by large funds.
Pair trading that went wrong

A notable pair trader was the fund LTCM, back in the 90’s. The petrol company Royal Dutch Shell had shares listed on two exchanges. One set of shares was for Shell, the other for Royal Dutch. However, Royal Dutch traded at a nearly ten percent premium to Shell. This is strange because these represent identical claims on the same company – common sense dictates they should have the same price. LTCM assumed the premium would disappear: they sold Royal Dutch and bought Shell.

All LTCM had to do was wait for the prices to converge. Unfortunately, that is exactly what it could not do. The premium widened to 22% in a short period. LTCM was forced to close its positions because of lack of liquidity in its other operations. It lost more than $100 million dollars on this trade alone.

Some references

Pair trading

  • Goodby, D. (2008). A Basic Introduction to Pairs Trading. TradingMarkets.com. Retrieved from http://www.tradingmarkets.com/.site/stocks/how_to/articles/-76543.cfm
  • Investopedia. (2011). Pairs trade. Investopedia. Retrieved from http://www.investopedia.com/terms/p/pairstrade.asp#axzz1Zkm97SeJ
  • Junge, C. (2011). A simple pair trading example. www.christoph-junge.de. Retrieved from http://www.christoph-junge.de/pairstrading.php
  • Preston, T. (2005, November). Pairs Trading. Traders Mag, 40 - 44. Retrieved from http://www.google.nl/url?sa=t&source=web&cd=1&ved=0CBwQFjAA&url=http%3A%2F%2Fmediaserver.thinkorswim.com%2Farticles%2FTPPairsTradingArticle.pdf&ei=ZMqSTsj_Ds3sOf6mzKgO&usg=AFQjCNET8DDNLyk7rI_RTsymC5opuBvbng&sig2=OsjJCEKVGDyDJEgAdj2QUQ
  • Skiena, S. (2008). Lecture 23: Pairs Trading. Retrieved from http://www.cs.sunysb.edu/~skiena/691/lectures/lecture23.pdf
  • Stone, C. (2011). The Secret to Finding Profit in Pairs Trading. Investopedia. Retrieved from http://www.investopedia.com/articles/trading/04/090804.asp#axzz1Zkm97SeJ
  • The Hedge Fund Guide. (2011). Pair trading. www.thehedgefundguide.com. Retrieved from http://www.thehedgefundguide.com/pairstrading.html
  • Wikipedia. (2011). Pairs trade. Wikipedia. Retrieved from http://en.wikipedia.org/wiki/Pairs_trade

LTCM

  • Wikipedia. (2011). Dual-listed company. Wikipedia. Retrieved from http://en.wikipedia.org/wiki/Dual-listed_company
  • Wikipedia. (2011). Long-Term Capital Management. Wikipedia. Retrieved from http://en.wikipedia.org/wiki/LTCM